Vote Summary & Statistics
After the moderator reveals votes, the Vote Summary modal opens automatically with a detailed breakdown.
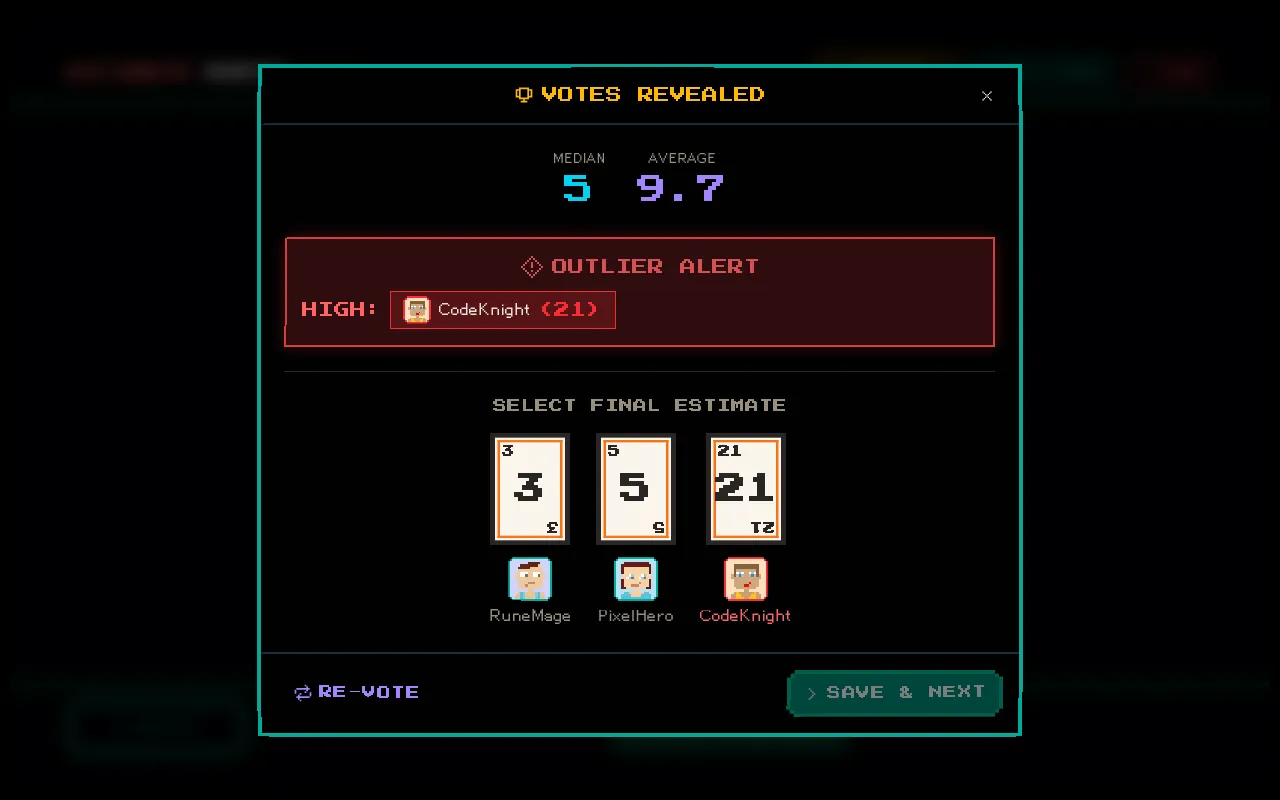
Statistics Displayed
Section titled “Statistics Displayed”| Statistic | Description |
|---|---|
| Average | Mean of all numeric votes |
| Median | Middle value when votes are sorted |
| Mode | Most frequently chosen value |
| Standard Deviation | How spread out the votes are — lower means more agreement |
Outlier Detection
Section titled “Outlier Detection”Votes that deviate significantly from the group average are automatically highlighted as outliers. This draws attention to estimates that may indicate:
- Hidden complexity that only one team member sees
- A misunderstanding of the ticket scope
- Different assumptions about the implementation approach
Outliers are the most valuable part of Planning Poker — they spark the discussions that improve estimates.
Per-Group Breakdown
Section titled “Per-Group Breakdown”When a ticket is assigned to multiple groups, the summary shows votes grouped by team. Each group gets its own:
- List of individual votes
- Statistical summary
- Consensus indicator
Consensus Detection
Section titled “Consensus Detection”If all voters in a group selected the same value, the estimate for that group is auto-populated with that value. The moderator can still override it.
This saves time on tickets where the team agrees — just confirm and move on.
Setting Estimates
Section titled “Setting Estimates”From the summary modal, the moderator can:
- Review the statistics and discussion
- Set a per-group estimate for each group that voted
- Set the final overall estimate
- Click Complete to finalize the ticket
Alternatively, Reset Votes to run another round, or Skip to move on without an estimate.